Deriving Golden Signals from Trace Spans: A Local Kubernetes Chaos Engineering Lab
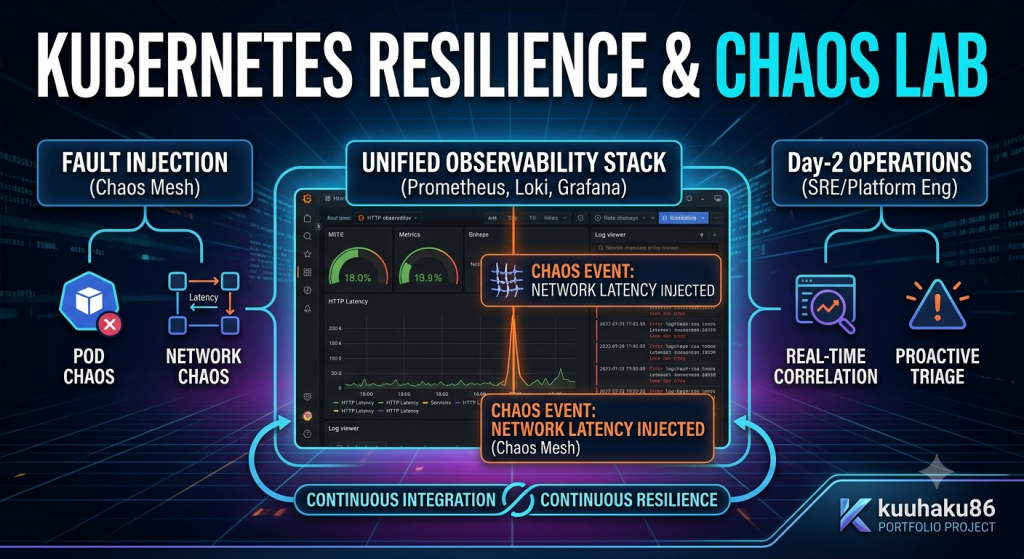
Nowadays, modern application architecture is become more and more complex. And this complexity will comes with some problems like high CPU usage, network degradation, and maybe some random pod that crashes on production environment. And usually we have our monitoring and alerting system that will make us aware about those problems. But we also need to check if our monitoring and alerting system is always reliable or not since waiting for an incident to occur before test your monitoring stack is a recipe for disaster.
So here we will create a project to practice the setup of a local Kubernetes reliability lab. We will combining three pillars of observability stack (metrics, logs, and traces) as our monitoring system, then we will have an automated fault injection system that will test our system via Chaos Mesh.
The tech stack that we will use is k3d, Helm, Prometheus, Grafana, Loki + Promtail, Tempo, Chaos Mesh, OpenTelemetry.
System Architecture & Observability Setup
Well, here’s the diagram flow of the project:
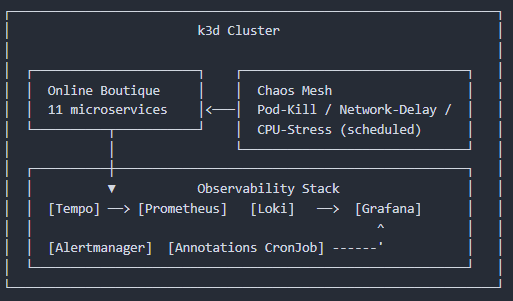
The diagram shows that app will emits spans (via the OTel collector) to Tempo, that will stores them as traces and also derives Golden Signals metrics from them, then push it into Prometheus. Independently, Promtail ships container logs into Loki. When Chaos Mesh runs an experiment, the fault will shows up in all three stores at once: Prometheus (metric spike), Tempo (the actual failed traces), and Loki (crash/error logs). Even though the logs arrived via a completely separate pipeline than the metrics and traces.
For the detail of the flow and cluster blueprint:
- Target App: Online Boutique’s 11 microservices, instrumented with OpenTelemetry, exporting spans via OTLP/gRPC, so there’s no
/metricsendpoints and we don;t need ServiceMonitors either. - Traces: Tempo receives OTLP spans directly from the app.
- Metrics: Tempo’s metrics-generator (
span-metrics+service-graphsprocessors) derives RED metrics (traces_spanmetrics_calls_total, latency histograms) from those same spans and remote-writes them into Prometheus. - Logs: Promtail DaemonSet ships container stdout/stderr into Loki.
- Grafana: Single pane visualizing all three, with a Tempo to Loki datasource correlation (
tracesToLogsV2) wired up. - Chaos Engine: Chaos Mesh injecting scheduled faults into the app namespace.
The Three Pillars of Failure Injection (Chaos Engineering)
The Chaos Engine will execute three experiments to the app. Those experiments are:
- Pod Kill (Fault Tolerance): It will kills
checkoutserviceevery 5 minutes for 60s to verify Kubernetes auto-healing (ReplicaSets) recovers without extended downtime. - Network Delay (Latency & Packet Loss): It will injects 500ms latency into
cartserviceevery 10 minutes to observe how timeouts and downstream latency propagate through the request chain. - CPU Stress (Resource Saturation): It will simulates 95% CPU load on
frontendevery 15 minutes to trigger theHighLatencyalert and visibly move the CPU/memory saturation panels.
Those experiments will be executed by Schedule component from Chaos Mesh on chaos-testing namespace.
The “Aha!” Moment: From Metric Spike to Root Cause in Three Hops
This will be the part of the lab that actually matters to an SRE reading this article. We will not go to “I have dashboards,” exclamation but “I can go from something is wrong to here is exactly why in under a minute, without grep-ing through logs by hand.”
Step 1: The chaos event marks itself on the graph.
Every two minutes, a CronJob will polls Chaos Mesh for anything that currently running:
kubectl get podchaos,networkchaos,stresschaos -n chaos-testing -o jsonFor any active experiment, it will reads the start/end time straight off from the resource’s status conditions and POSTs an annotation to Grafana’s API. The payload will be tagged with the experiment kind (podchaos, networkchaos, stresschaos) and pinned to the Resilience dashboard. So when checkoutservice gets killed, there’s already a vertical marker on the graph that labeled Chaos: PodChaos/checkoutservice-kill active before you even notice that the metrics moved.
Step 2: The metric spike is undeniable, and the alert fires.
A few seconds later, traces_spanmetrics_calls_total for checkoutservice shows the error ratio climbing, and the HighErrorRate rule’s span error rate over 5% for 2 minutes, it will fires in Alertmanager. On the Golden Signals dashboard, the annotation and the spike line up on the same timestamp, so there’s no ambiguity about cause and effect: this isn’t background noise, it’s the chaos experiment.
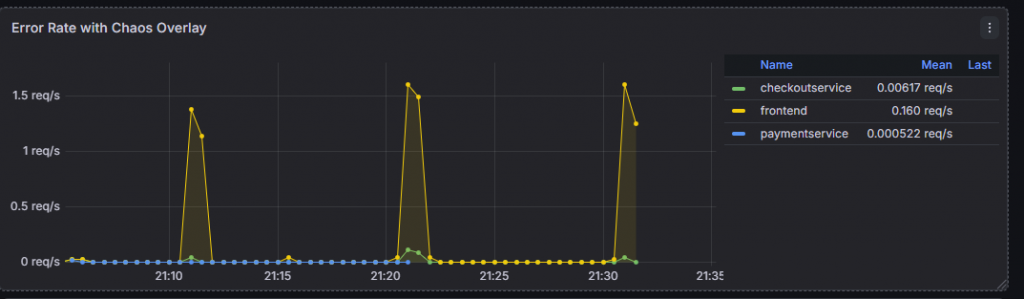

Step 3: Drill from the spike into the actual trace.
This is usually where most “observability demo” articles stop at a Prometheus graph, but a request-rate check doesn’t tell you why a request failed. So from that spike, I jump into Grafana Explore against the Tempo datasource and pull the actual failing trace: the exact span where cartservice didn’t respond, with its duration, status, and parent/child context intact.
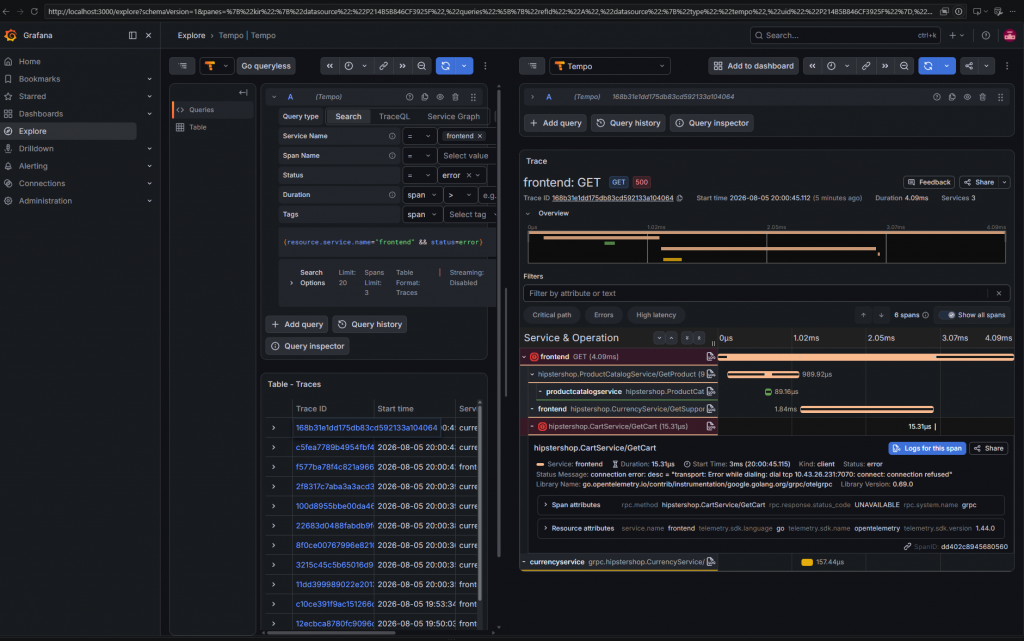
Step 4: The trace hands you the logs, automatically.
Digging through logs by timestamp is exactly the kind of manual correlation this lab is designed to avoid. Instead, Tempo’s Grafana datasource is configured with tracesToLogsV2, mapping the span’s service.name to Loki’s app label:
jsonData:
  tracesToLogsV2:
    datasourceUid: loki
    filterByTraceID: false
    spanStartTimeShift: "-5m"
    spanEndTimeShift: "5m"
    tags:
      - key: service.name
        value: app
filterByTraceID is deliberately put off, the app’s services never print a trace ID into their log output, so text-matching would never find anything. So the click doesn’t teleport you to one exact line, it will takes you to that service’s logs in a tight window around the failing span, which is usually enough to spot the error by eye or with one added filter like |= "error".
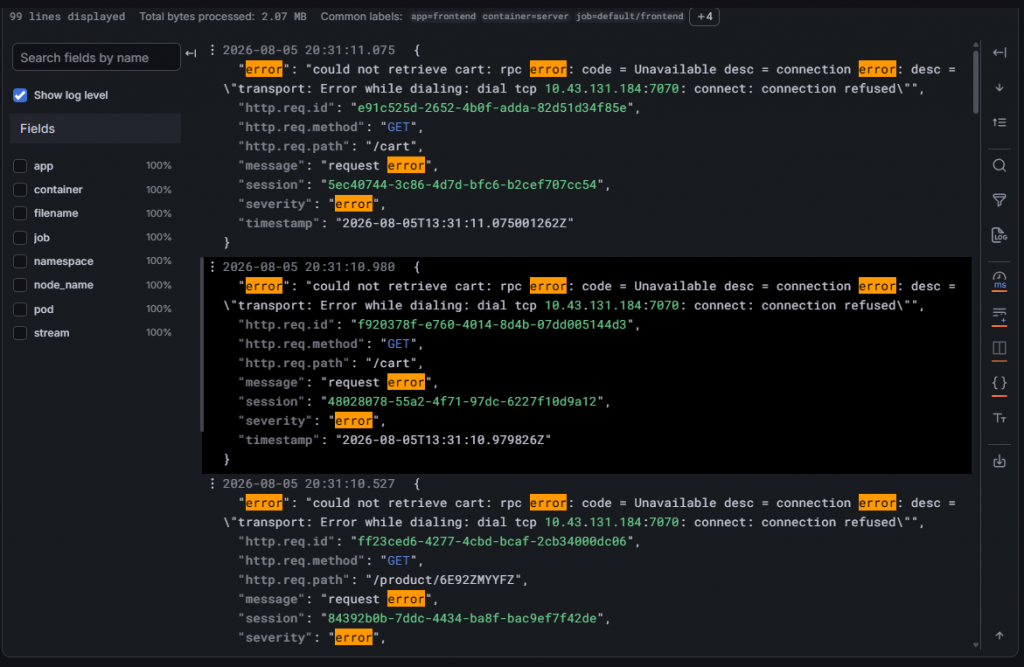
So the end-to-end flow is: annotation marks the fault → metric confirms the blast radius → trace pinpoints the failing request → the correlated logs surface the root cause. Four signals, one click-path, and every hop was populated from a single stream of OpenTelemetry spans plus one independent log pipeline, not four separate tools bolted together after the fact.
Developer Experience & Automation
Every dashboard, alert rule, and chaos experiment in this project is just a plain YAML file or ConfigMap, that committed to the same repo as everything else. Nothing was clicked and setup in the Grafana UI and left undocumented. That thing matters more than it sounds: when we hunt down the error on the project, the fix was a quite simple since it’s written on a YAML file, not a UI setting that would vanish on the next helm upgrade.
The whole stack also comes up with one command:
make up      # cluster + app + monitoring + chaos, in order
make status  # pods, chaos experiments, alert rules
make down    # tear it all down
So, there’s no manually sequencing kubectl apply across a dozen manifests, no need to remember which Helm chart depends on which namespace existing first, make up will handles that ordering for you. Combined with the annotations CronJob and the alerting rules, that’s the whole point: a reliability lab you can stand up, break on purpose, and tear down again, repeatably, without hand-holding it back to a working state each time.
Conclusion
None of the Golden Signals dashboard, the pod-kill/network-delay/CPU-stress experiments, the one-click trace-to-log correlation will proves much if you can’t trust where the numbers came from. That’s the real value of building this locally first: when anything goes wrong, we can fix it directly, those weren’t hidden by a polished demo, they will show up immediately, in a dashboard, with nothing at stake. Fixing them there is a lot cheaper than discovering the same gaps during a real production incident.
That’s the pitch: testing resilience of the app and of the observability stack watching it locally, on purpose, before either one has to prove itself for real.
Try It Yourself
GitHub: centralized-observability-chaos (https://github.com/kuuhaku86/centralized-observability-chaos)
Portfolio/Blog: https://kuuhaku86.github.io
Leave a Reply